User Tools
Sidebar
operations:documentation:pointing_monitoring
This wiki is not maintained! Do not use this when setting up AuScope experiments!
Monitoring and plotting pointing data during a pointing run
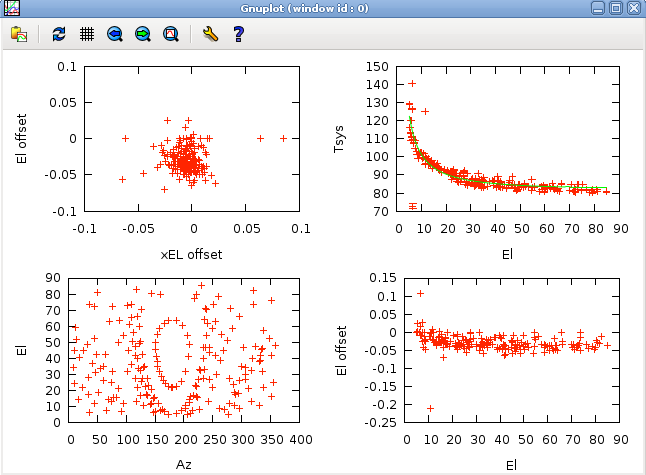
When doing a pointing run using the point procedure file and acquire command, results are logged in /usr2/log/sx.log and they can be plotted to keep track of progress. Here's an example of what can be done. Copy and paste this into a file on the pfcs machine, then 'source' it.
egrep '(xoffset)' /usr2/log/sx.log > xoff.txt
egrep '(tsys)' /usr2/log/sx.log > tsys.txt
gnuplot <<EOF
unset key
set angles degrees
f(x) = m*(1/cos(90-x)) + c
fit f(x) 'tsys.txt'  using 3:4  via m,c
set multiplot layout 2,2
set xlabel 'xEL offset';set ylabel 'El offset';plot [-0.1:0.1] [-0.1:0.1] 'xoff.txt' u 4:5
set xlabel 'El';set ylabel 'Tsys';plot 'tsys.txt' u 3:4:5 w errorbars, f(x)
set xlabel 'Az'; set ylabel 'El';plot 'xoff.txt' u 2:3
set xlabel 'El'; set ylabel 'El offset';plot 'xoff.txt' u 3:5
unset multiplot
pause mouse any "\nAny key or button in the plot window will terminate\n"
EOF
This will make a 2 x 2 plot showing pointing offsets, points on the sky observed, Tsys vs El (and a fit to Tsys vs sec(z)) and Elevation offset vs elevation. Clicking in the plot window will dismiss the plot.
/home/www/auscope/opswiki/data/pages/operations/documentation/pointing_monitoring.txt · Last modified: 2013/02/20 03:28 by Jim Lovell

