User Tools
Sidebar
This wiki is not maintained! Do not use this when setting up AuScope experiments!
Autocorrelation spectra plots
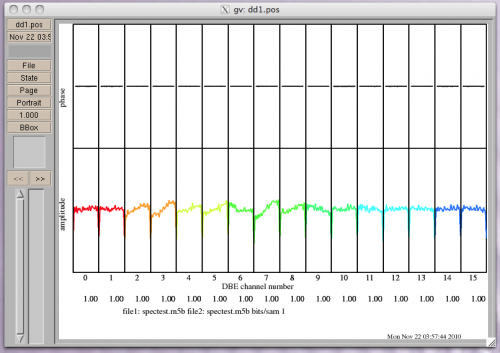
At the end of every scan, the postob procedure will run a script to extract some Mark5 data and display the autocorrelations of the 16 channels. Good data should contain quite flat bandpasses and zero phase. For example:
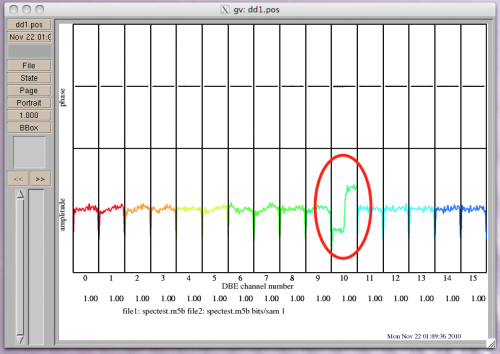
If the spectra look like this, then everything is OK, dismiss the gv window. The DBBC will sometimes drop channels, resulting in zero amplitude autocorrelations, or may show strange spectra with a step in the middle, like this:
In these cases, it is necessary to reprogram the DBBC. Instructions are here
Please make a note in the log when you reprogram the DBBC. Note that previous spectra plots are kept on pcfshb in /home/oper/auto_cor_test so it's possible to view these and see when problems occurred. To view these files, use gv, e.g.
gv 2010_11_22_024630.epi
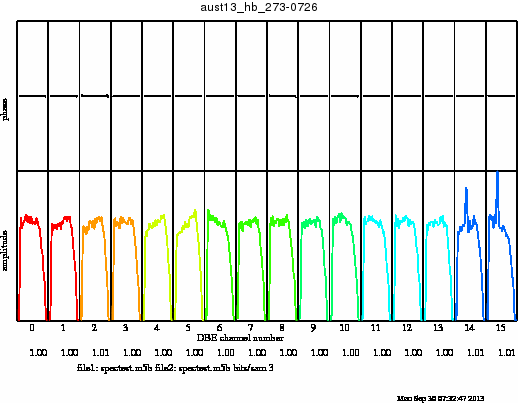
For an AUST experiment the filters make the channel spectra look like this example from hb 12m:
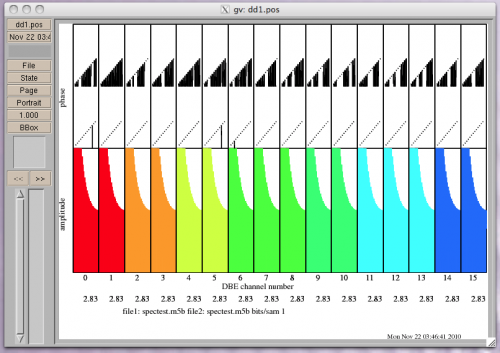
Sometimes, a spectrum will look like this:
This appears to be a bug in the extraction/plotting software (it happens when the software extracts no data) and can be safely ignored. Wait for the end of the next scan to see the next plot.


