User Tools
Sidebar
This wiki is not maintained! Do not use this when setting up AuScope experiments!
This is an old revision of the document!
Table of Contents
Starting and Monitoring IVS sessions on the Hobart 12m
PC Field System
Start the schedule with e.g.
schedule=r4447hb,#1
as usual. Then send a start message to IVS.
If in the operations room, start econtrol:
Applications -> AuScope Hobart -> econtrol
Click on the boxes next to “StatusMonitor“ and “Logging and Operator Input”. This should trigger the program to connect to pcfshb and you’ll see a status window and log window. If you don't see any information updating in the status window, type [ctrl]-[shift]-e to start the server process on the field system. You can send PCFS commands and comments from the bottom of the log window. Note you won’t see the log window update until the next scheduled command is sent.
During the experiment, the following checks can be made. Please log them using the new Checklist GUI rather than the paper checklist:
Please go through the checklist as often as you like but at least once every 2 hours. Below is an explanation of the current list of items to check during an observation:
- HMI: Antenna drives OK
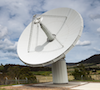
Check the antenna status display in HMI on the Windows PC (to view it, start a VNC session via the Applications menu to timehb). If DRIVES STATUS, SOFT LIMITS, DEMAND LIMITING and HARD LIMITS are all green then all is well. - HMI: Time OK (i.e. SNTP server OK)
Check the antenna status display in HMI on the Windows PC (to view it, start a VNC session via the Applications menu to timehb). If the CURRENT TIME area reports SNTP SERVER OK, then the controller knows the time. If not, the antenna probably doesn't know where its pointing, there's a problem. - Antenna on source and tracking
In econtrol, typeonsourceand check the antenna is tracking, which it should be provided a new source command hasn't recently been issued. - Autocorrelations OK
At the end of every scan, the postob procedure will run a script to extract some Mark5 data and display the autocorrelations of the 16 channels in the PCFS VNC session. Good data should contain quite flat bandpasses and zero phase. See autocorrelation spectra plots for an example and what problems to look out for. If there's a problem, the DBBC may need reconfiguring. - delays OK, stable and within 1us (clkoff, maserdelay)
In the econtrol, issue the commandsclkoffandmaserdelay. These values should be within 0.5 microsecond of each other and stable (i.e. similar results if you issue the commands again). The monitoring software will calculate the difference for you and should ring an alarm if the difference is not acceptable. See this entry in the common Problems section for a remedy. - Maser status OK
Check the “Standard VCH-1005A Manager” display on the Windows PC (to view it, start a VNC session via the Applications menu to timehb). Green numbers are good, red are bad. Here's an example of how it should look:
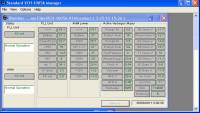
Report any red numbers to Brett ASAP. if you see mention of 'Battery', the maser has lost mains power and is running on it's UPS. If so, tell Brett immediately. - mk5=mode? correct
Check mode with this command in econtrol:mk5=mode?. The result should be
/mk5/!mode? 0 : ext : 0x55555555 : 2 : 2 ;for R1 and R4 experiments,
/mk5/!mode? 0 : ext : 0x55555555 : 4 : 2 ;for OHIG, APSG and CRF observations. - mk5=dot? response nominal
This is a check of the Mark5 decoder time. Check the time offset in the formatter with this command in econtrol:mk5=dot?. Make sure it reports a small offset (~<10ms) as the final value, thatsyncerr_eq_0and thatFHG_onorFHG_offdepending on whether it is currently recording or not. - disk_pos OK
The commanddisk_posin econtrol should report three values - the current number of btyes recorded, bytes at start of previous scan and bytes at start of current scan. If not currently recording, the first and third values should agree. It is normal for Yarragadeedisk_posto lag its expected value due to regular stows for USN uplinks. - Weather (wth) being logged
Look through recent messages in the field system log for output from thewthcommand, which will look like this:\\/#wx#/16.1,1007.9,58.6\\Also make a note in the log of present weather conditions (if you're at the observatory). - S-band Tsys OK (~15-17)
Check recent output from a systemp12 command (don't execute it unless the Mark5 is NOT recording) to see is the S-band Tsys is within the expected range: about 15 to 17 cal units. Look for “tsysS” in the log. Make a note in the log if it is outside this range. If it persists, or the values vary wildly, there may be a problem. - X-band Tsys OK (~5-7)
Check recent output from a systemp12 command (don't execute it unless the Mark5 is NOT recording) to see is the X-band Tsys is within the expected range: about 5 to 7 cal units. Look for “tsysS” in the log. Make a note in the log if it is outside this range. If it persists, or the values vary wildly, there may be a problem. - Any problems or concerns logged
If there are any other issues or unusual behaviour, report it in the log by typing a comment preceeded by double quotes in econtrol - Field System time (monit2) agrees with station time
Compare the clock shown in the monit2 display in the PCFS VNC session with the station clock (if you're at the observatory) or with the TAC32 GPS clock in the Tac32Plus display on the Windows PC (to view it, start a VNC session via the Applications menu to timehb). The seconds should tick over together. If they don't, the clocks probably need synchronizing. To run the monit2 status monitor, enter this command at the pcfshb prompt in the VNC session/usr/bin/xterm -name monit2 -e /usr2/fs/bin/monit2

Common problems
Formatter to FS time offset
You might get a
ERROR sc -13 setcl: formatter to FS time difference 0.5 seconds or greater
to fix this do a:
sy=run setcl offset
Note this error is likely to reappear regularly.
Note also that the error message
?ERROR sc -18 setcl: program is already running, try "run setcl" instead.
has been seen recently when the command is issued from a terminal window. The problem has not been seen when the command is entered into the oprin window. If you do get this error when entering the command into the oprin window, please tell Jim.
FS time is out by several seconds
The origin of this problem is presently unknown but the FS time can get seriously out of step. To fix this, while not recording start the fmset program from an oper@pcfshb terminal and issue the ”+” and “-” commands, then quit from fmset (ESC). Restart fmset and the FS time should now be correct. You may need to resync the mark5B pps after this procedure.
clkoff reading is drifting or far from the maser-GPS offset
This usually is caused by the DBBC. First, go around the back of rack 14 and move the cable from the DOTMON output of the Mark5B to the “1 PPS Mon” output of the DBBC (left hand side, sixth SMA from the top). If the same offset is seen on the counter, then the problem in in the DBBC. A temporary fix can be achieved with pps_sync in DBBC Control but this did not reliably fix the problem on 13/10/10. Instead, try reconfiguring the DBBC with reconf - this will take ~two minutes in total and you will need to re-issue the dbbcifa=… commands, and resynch the mark5B with fmset.
PCFS log window reports problem with ReadPower.sh
This occurs when communication with the power sensor (a USB device) in the IF rack is lost. The power sensor is required for System Temperature (Tsys) measurements. The solution is to cycle power to the sensor by unplugging it's USB connection into the Field System PC and then plugging it back in again. If you are not at the site, and cannot contact anyone on-site to fix it, you can disable the Tsys measurements as follows:
On pcfshb:
pfmed
pfmed: pf,station
pfmed: ed,systemp12
An editor will start. Comment out the command by putting a double-quote at the start of the line. It should then look like this:
"sy=/usr2/oper/systemp12rcp.sh &
Now exit the editor, and
pfmed: exit
Lastly, please make a note in the log that Tsys measurements have been disabled.
It is possible to remotely reset the power sensor at both Yarragadee and Hobart. You should first follow the procedure outlines above, then kill any remaining systemp12rcp.sh or ReadPower.sh processes running on pcfsyg/pcfshb (use ps -ef | grep ReadPower to identify the process IDs). Become root with su and issue the command
/etc/init.d/AgilentU2000 restart
It will run a series of procedures to toggle the power and then try to re-establish communications. It may take two tries to get it fully working - when it is ok, you should get a blithely cheery message to this effect, and be wished good luck. When you receive this message, wait for a break in the recording and test the power sensor by running /home/oper/systemp12rcp.sh. All being well, there should be no timeouts although the measured power is likely to be nonsensical (there will be bogus values written into the data from the previous timeouts). If it fails with timeouts, persevere with the /etc/init.d/AgilentU2000 restart procedure. Once you have it working, repeat the pfmed process and remove the comment from the systemp12 procedure.
Antenna off source and not moving in Azimuth
Currently there’s a fault that sometimes develops in the Hobart 12m drives (or the control software) that causes the antenna to stop moving in Azimuth. If this happens the station alarm should sound and the PC Field system will report an error like this:
WARNING: ONSOURCE status is SLEWING.
You will also notice that the antenna control/monitoring GUI (called HMI) on the Windows PC will show constant azimuth position, and probably the Azimuth brakes on. You can see this display by starting up a VNC session to timehb.
To fix this problem, click on “Reboot System”, then either wait for the schedule to send the antenna to the next source, or look back through the schedule and re-issue the last “source=…” command. (Note the ‘onsource’ command doesn’t seem to remedy the problem at the moment. Check the snap file for the syntax of the command & the most recent usage). The “Reboot System” button is shown here:

The above screenshot shows the antenna in a healthy state. You will see various boxes in the POWER and DRIVES STATUS areas go red when there’s a problem.
If econtrol gets closed during an observation
Recording continues as econtrol is a front-end viewer for the field system, so don't panic :)
When you restart econtrol from the menu it may be unable to load the telescope information (the drop-down menu boxes), and the terminal from which econtrol runs produces “Can't open interface” type errors. If this happens, in the econtrol window (the green one, not the terminal) press Control+shift+e, and then try to open one of the drop down boxes again - this time the icon in the bottom right corner should go from red through 'connecting' to green, the information will now load, and observing can continue as normal.